Over/under 2.5 goals is the most popular football betting market after the match result, and the easiest one to get wrong. It looks simple — will there be three or more goals, or won’t there? — which is exactly why most people bet it on instinct rather than on anything resembling evidence.
This guide covers what the market actually means, which statistics genuinely predict total goals, which ones look useful but aren’t, and how to judge whether a price is worth taking. It’s the market our models cover most often, and the one where a small amount of homework goes furthest.
What over/under 2.5 goals actually means
The market asks a single question: how many goals will both teams score combined during normal time? Over 2.5 wins if there are three or more. Under 2.5 wins if there are two or fewer. The half-goal exists purely to remove the possibility of a draw on the bet itself — you can’t score 2.5 goals, so there’s always a clear winner. Because it has only two outcomes, this market is also the most common place for a two-way arb; our arbitrage calculator works out the stakes.
Two details catch people out. Own goals count normally. And only regulation time counts — goals in extra time in a cup tie don’t affect the bet, and neither do penalty shootouts.
Why 2.5 is the line that matters
Across Europe’s major leagues, the long-run average sits at roughly 2.6 to 2.8 goals per match. That places 2.5 almost exactly at the midpoint of the distribution, which is why the market is usually priced close to even and why both sides are genuinely live in most matches.
Lines at 1.5 and 3.5 exist too, and they behave very differently. Under 1.5 needs a genuinely low-scoring game, and over 3.5 needs an unusually open one — both are longer prices with correspondingly lower hit rates. The 2.5 line sits where small edges in your reasoning translate into the biggest practical difference.
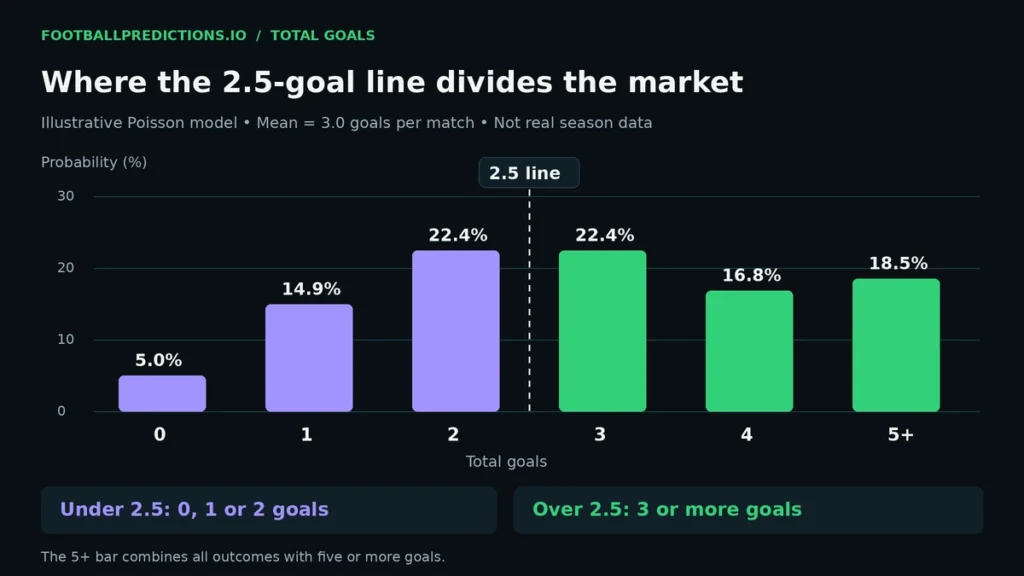
How total goals are distributed across a typical league season — 2.5 sits close to the centre.
The statistics that actually predict total goals
Combined xG, not combined goals
Add the expected goals each side typically generates to the expected goals each side typically concedes, and you have a far better estimate of a match’s likely goal total than any record of actual results. Goals are noisy over short samples; underlying chance creation is not.
Shot volume and shot location
Two teams that both take a high volume of shots from inside the box will generally produce more goals than two teams trading long-range efforts. Total shots alone is a weak signal; shots from good positions is a strong one.
Defensive line height and pressing style
A side that presses high and defends with a line near halfway concedes more clear chances on the counter than one that sits deep. When two high-pressing teams meet, the game tends to stretch and goals follow. Two deep, compact sides tend to cancel each other out.
League baseline
Scoring rates differ meaningfully between competitions, and that baseline shifts the starting point for every match in it. Some leagues have historically produced notably more goals per game than others, so a “high-scoring team” in a low-scoring league isn’t the same thing as one in a high-scoring league.
Match context and stakes
A dead rubber between two mid-table sides with nothing to play for often opens up. A relegation six-pointer or a tight title race fixture frequently doesn’t. Cup finals and derbies tend to be more cautious than the quality of the teams alone would suggest.
Signals that look useful but aren’t
- “Both teams have gone over in their last five.” Ten matches of form is a tiny sample, and it tells you nothing about how these two specific sides interact.
- Head-to-head goal records. Meetings from three seasons ago involved different squads, different managers and different tactical systems.
- “They’re both attacking teams.” Attacking intent doesn’t guarantee goals if both defences are also strong, or if one side simply dominates possession without penetration.
- Weather, in most cases. Heavy rain or strong wind can matter at the margins, but it’s routinely overweighted relative to actual effect on scoring.
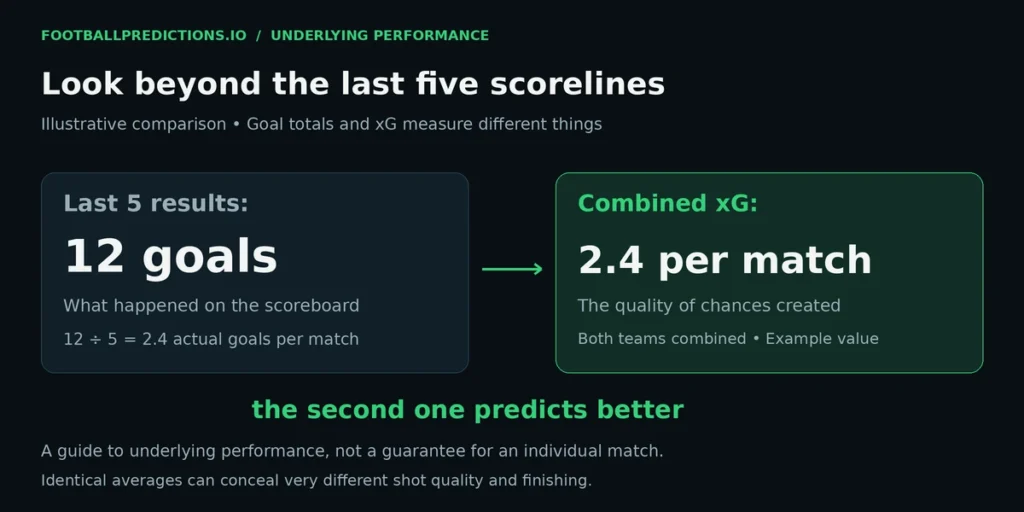
Underlying chance creation predicts goals far better than recent results do.
Turning your estimate into a bet
Once you have an estimate of a match’s expected total goals, you still need the price to justify the bet. Convert the odds to implied probability and compare.
| Expected total goals | Rough over 2.5 chance | Fair odds | Take over 2.5 if priced above |
|---|---|---|---|
| 2.2 | ~44% | 2.27 | 2.35 |
| 2.6 | ~52% | 1.92 | 2.00 |
| 3.0 | ~58% | 1.72 | 1.80 |
| 3.4 | ~65% | 1.54 | 1.60 |
The final column is the point of the exercise. If your estimate says 2.6 expected goals and the market is offering 2.10 on over 2.5, there’s a gap worth acting on. If it’s offering 1.80, there isn’t — the price has already caught up with the reasoning.
Common mistakes in this market
- Betting overs because it’s more fun. Backing goals means every match feels alive for 90 minutes, and bookmakers know it — overs are frequently the shorter-priced side relative to their true chance.
- Ignoring the defensive half of the equation. A prolific attack meeting an organised defence is not the same match as a prolific attack meeting a leaky one.
- Chasing an in-play over after a goalless first half. The price gets longer for a reason: there’s less time left for goals to arrive.
- Treating 2.5 as one market everywhere. The same expected goal total produces different value depending on the league baseline and the specific price on offer.
How we approach over/under on this site
Total goals is one of the markets our models handle best, because goal-based approaches like Poisson produce the full distribution of scorelines directly — meaning the over/under probability falls out of the same calculation that produces everything else. We publish an over/under tip only when that probability differs meaningfully from what the market is pricing.
Frequently asked questions
What does over 2.5 goals mean exactly?
It means three or more goals in total across both teams during normal time. Two goals or fewer wins the under. Extra time and penalties don’t count.
Do own goals count towards over/under?
Yes. Every goal scored in normal time counts towards the total, regardless of who put it in the net.
Is over 2.5 or under 2.5 more likely?
It varies by league and by match, but across major European competitions the two sides land close to even overall, with over holding a slight edge in higher-scoring leagues. Neither side is inherently the better bet — the price decides that.
Why do bookmakers offer different lines like 2.25 or 2.75?
Those are Asian-style split lines, where your stake is divided across two adjacent lines. A 2.75 line splits between 2.5 and 3.0, so exactly three goals gives you a half win rather than a full one.
Is over/under easier to predict than the match result?
Not easier, but often more stable. Goal totals depend less on which specific side wins a tight game, so they’re less vulnerable to a single late winner flipping the outcome of your bet.
How many matches of data should I look at?
Aim for at least eight to ten recent matches per team, and weight underlying numbers like xG more heavily than raw goals. Anything under five matches is too small a sample to draw a conclusion from.
Over/under 2.5 rewards patience more than excitement. The matches worth betting aren’t the ones that look like goal fests on paper — they’re the ones where the price hasn’t quite caught up with what the underlying numbers are saying.
18+. Betting involves risk and you should never stake more than you can afford to lose. If gambling stops being fun, support is available at GambleAware.org.