You’ll see expected goals (xG) on almost every match graphic now — a small decimal number next to each team, like “Arsenal 2.1 — 0.6 Brighton.” Most people glance at it, nod, and move on without really knowing what it means, or why pundits and analysts trust it more than the actual scoreline.
This guide breaks down expected goals properly: how it’s calculated, why it’s more reliable than goals scored, what a good and bad xG performance looks like, and — just as important — where the metric falls short and shouldn’t be trusted blindly. By the end, that little decimal number will tell you a lot more than it does right now.
What expected goals (xG) actually measures
Expected goals measures the quality of a scoring chance, not whether it went in. Every shot in a match is given a value between 0 and 1 — its probability of resulting in a goal, based on thousands of historical shots with similar characteristics. Add up every shot’s value across a match and you get that team’s total xG.
A tap-in from two yards with an open goal might carry an xG of 0.95 — it goes in 95% of the time historically. A speculative strike from 30 yards might be worth 0.02. A team can have five shots worth 0.1 each (0.5 total xG) or one shot worth 0.5 — completely different games, identical xG total.
What goes into a shot’s xG value
Several factors combine to price each chance:
- Distance from goal. Closer shots score more often — this is the single biggest factor.
- Angle to goal. A shot from a tight angle, even close in, is harder to convert than one straight in front.
- Body part. Headers convert at a lower rate than shots taken with the foot.
- Assist type. A through ball or a cut-back tends to produce a better chance than a shot from open play with no clear setup.
- Defensive pressure. Whether a defender is closing down the shooter, and how many opponents are between the ball and goal.
- Type of play. Open play, a set piece, a penalty (fixed at roughly 0.76) or a one-on-one with the keeper are each priced differently.
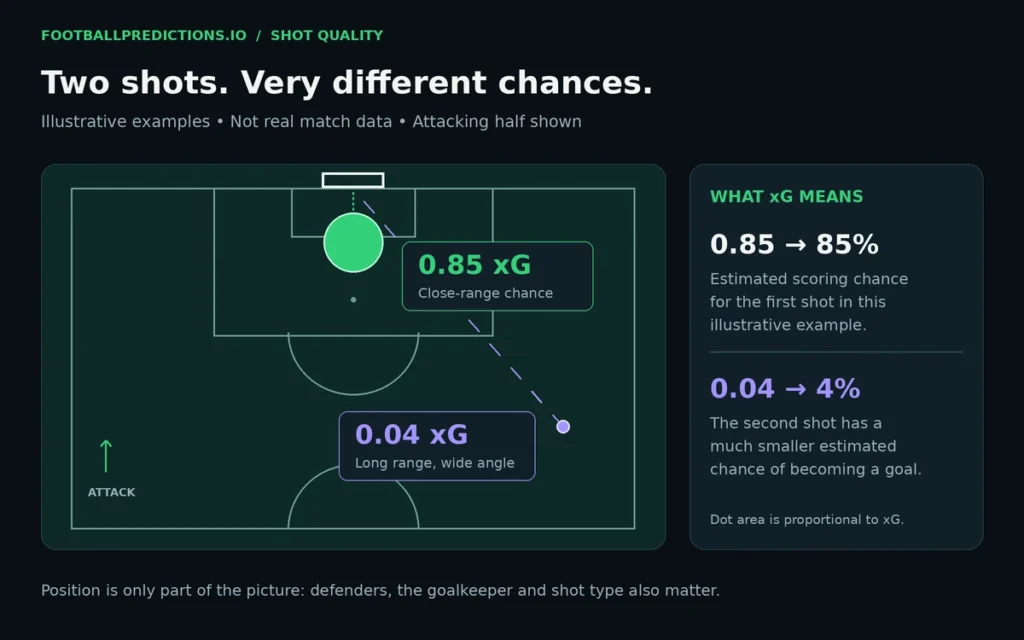
Two shots, two very different xG values — location and angle are doing most of the work.
Why xG is more reliable than the scoreline
Goals are a small sample. A single deflection, a goalkeeping error, or a moment of individual brilliance can decide a match without reflecting who actually created the better chances. Over one game, results are noisy. It’s the same trap that makes double chance betting feel safe: a run of results says less than it seems. xG strips out the noise of finishing — good or bad, lucky or unlucky — and shows you the quality of chances created, which is far more repeatable from week to week than goals scored.
This is why a team can lose 1-0 having generated 2.4 xG to their opponent’s 0.3, and analysts will still call it a strong underlying performance. The scoreline says one thing; the process says another — and over a season, the process tends to catch up with the results.
Reading the gap between xG and actual goals
The difference between a team’s actual goals and their xG total (often written as G-xG) is one of the most useful numbers in football analytics.
| Situation | What it usually means |
|---|---|
| Goals well above xG, over many matches | Finishing above their normal level — often not sustainable long-term |
| Goals well below xG, over many matches | Below-average finishing, or facing strong goalkeeping — often regresses upward |
| Goals roughly equal to xG | Performance matches underlying chance quality — the most stable case |
| Large gap in a single match only | Mostly noise — one game is too small a sample to draw conclusions from |
A striker scoring well above their xG for a season is often flagged as due a dip in form — not because they’ve gotten worse, but because finishing rates tend to level out over enough shots. The reverse is just as true: a team stuck below their xG for months is frequently a side about to turn a corner.
What xG cannot tell you
xG is powerful, but it isn’t the whole picture, and treating it as gospel is its own mistake.
- It doesn’t know who’s shooting. A chance taken by an elite finisher and the same chance taken by a weak one carry the same base xG value in most public models.
- It undervalues genuine quality finishing. Some players consistently outperform their xG over years, not just one hot streak — the metric treats that as an anomaly rather than a skill.
- It’s a snapshot of chances, not of dominance. A team can rack up xG against a defence sitting deep with little real intent to press forward.
- Small samples are unreliable. One match’s xG tells you much less than ten matches’ worth — treat single-game xG as a hint, not a verdict.
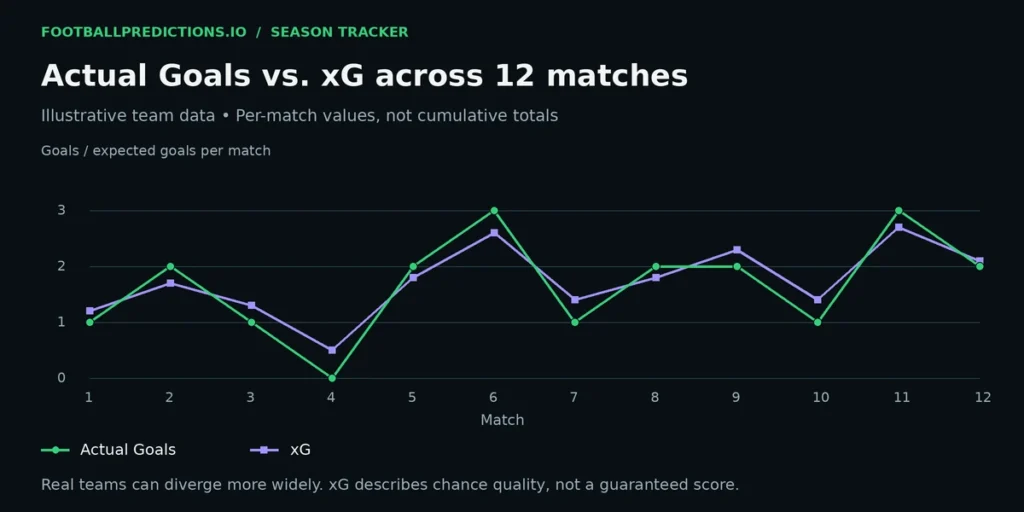
A single match’s xG is a snapshot — the picture sharpens as more matches are added.
Related metrics worth knowing
A few variants extend the basic idea:
- xGA (expected goals against) — the same calculation applied to chances a team concedes, used to judge defensive quality independent of the goalkeeper’s individual form.
- xG difference (xGD) — a team’s xG minus their xGA, often a better predictor of final league position than actual goal difference at the season’s midpoint.
- Non-penalty xG — xG with penalties excluded, useful for judging open-play chance creation without a striker’s penalty record skewing the number.
- xA (expected assists) — the xG value of the chance a pass created, crediting the passer for setting up a good opportunity regardless of the finish.
How xG feeds into our predictions
xG is one of the core inputs in our prediction models, precisely because it’s more stable match-to-match than goals scored or conceded. A team whose underlying numbers look stronger than their recent results suggest is exactly the kind of gap our models are built to catch before it shows up in the league table.
Frequently asked questions
What is a good xG for a football match?
There’s no fixed threshold, but as a rough guide, 1.5+ xG in a single match reflects a solid attacking performance, and 2.0+ is a genuinely dominant one. Context — the opponent’s quality and how the match was played — always matters more than the raw number.
Can a team have high xG and still lose?
Yes, constantly. Football is low-scoring enough that a single moment of poor finishing, good goalkeeping, or bad luck can flip a result regardless of who created the better chances.
Is xG the same across every data provider?
No. Different providers (Opta, StatsBomb, and others) use different models trained on different data, so xG values for the same match can vary slightly between sources. The trends they reveal are usually consistent even when the exact numbers differ.
How many matches of xG data do I need before trusting it?
As a rough rule, treat anything under 6-8 matches as a small sample. Ten or more matches of consistent overperformance or underperformance is a much stronger signal than a couple of standout or disappointing games.
Does a high xGA mean a team defends badly?
Usually, yes — it means they’re conceding higher-quality chances than average. But it can also reflect a deliberately attacking, high-risk style, so it’s worth checking alongside actual goals conceded and overall shape before drawing conclusions.
Why do some players consistently beat their xG?
Elite finishers can outperform the base model over long periods through genuine technical skill — placement, composure, technique in tight areas — that a generic shot-quality model doesn’t fully capture. It’s rare, but real, and usually only becomes credible after several seasons of evidence.
xG won’t tell you who wins on Saturday. What it tells you is who’s been creating the better chances — which, over enough matches, is a far more honest measure of a team’s real level than the scoreline alone ever is.
18+. Betting involves risk and you should never stake more than you can afford to lose. If gambling stops being fun, support is available at GambleAware.org.